


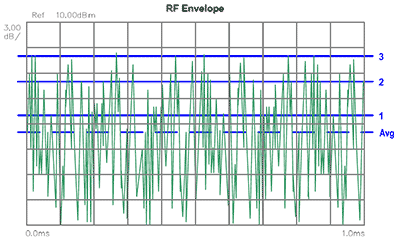
To better understand CCDF curves, a digitally modulated signal is examined. Figure A shows the power versus time plot of the digital signal. Observing the signal in the time domain, this plot represents the instantaneous envelope power defined by the equation: Power = I2 + Q2 where I and Q are the in-phase and quadrature components of the waveform.
Unfortunately, the signal in this form is difficult to quantify because of its inherent randomness and inconsistencies. In order to extract useful information from this noise-like signal, we utilize a statistical description of the power levels in this signal; a complementary cumulative distribution function (CCDF) curve provides us with the means.
A CCDF curve shows how much time the signal spends at or above a given power level. The power level is expressed in dB relative to the average power. For example, each of the lines across the waveform shown in Figure A represents a specific power level above the average. The percentage of time the signal spends at or above each line defines the probability for that particular power level. A CCDF curve is a plot of relative power levels versus probability.
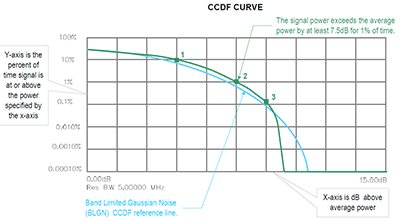
Figure B displays the CCDF curve of the same digitally modulated signal captured on the vector signal analyzer. Here, the x-axis is scaled to dB above the average signal power, which means we are actually measuring the peakto-average ratios as opposed to absolute power levels. The y-axis is the percent of time the signal spends at or above the power level specified by the x-axis. For example, at t = 1% on the y-axis, the corresponding peak-toaverage ratio is 7.5 dB on the x-axis. This means the signal power exceeds the average by at least 7.5 dB for 1 percent of the time. The position of the CCDF curve indicates the degree of peak-to-average deviation, with more stressful signals further to the right. Note that crest factor is an alternate terminology used to describe the highest peak to average ratio within the reference signal.
A notable observation is that the measured output waveform exhibits gain expansion in the regions 2 & 3 while we observe peak compression when the actual signal crosses below the Gaussian noise reference line.
Output power definitions using CCDF method
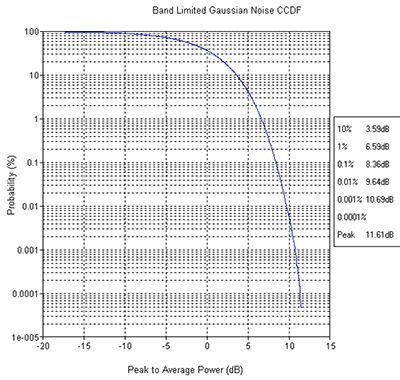
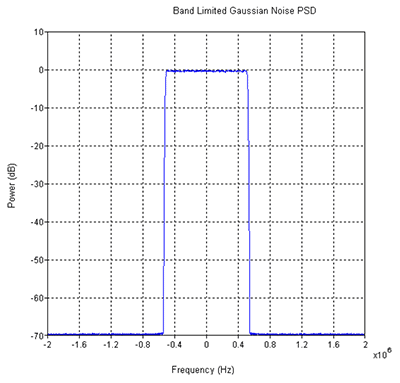
Output power is defined in terms of the 1 dB compression point (P1dB) and P3dB, which is practically very close to the saturated output power capability of the amplifier. P1dB and/or P3dB is measured using a complex modulation where i(n) and q(n) are random voltages with a Gaussian distribution and zero mean; i.e. broadband noise. The noise will be band limited to 1MHz. A reference waveform having salient characteristics shown in Figure C are utilized as the input signal. The PSD of the reference waveform appears in Figure D. Then, P1dB is the peak output power at which the original input signal is compressed 1dB at 0.01% probability. P3dB is the peak output power at which the original input signal is compressed 3dB at 0.01% probability.
Practical examples using the CCDF method to determine P1dB and P3dB are provided in the section that follows.
Background on output power definition and measurements using the CCDF method
The given reference signal consists of peak excursions that occur much less often or at much lower probability as compared to the average content of the waveform this establish a known peak to average ratio (PAR) or crest factor at 0.01% probably in the reference waveform. Using a reference signal of this nature allows measurements of amplifier gain compression to be accomplished at much lower average powers which can be a useful advantage.
The peak output power capability of an amplifier is often a function of the driving signal. For example, an amplifier driven by a high PAR digitally modulated signal will often provide higher peak power capability than what can be achieved using CW. Therefore, the definition of the stimulus is required in order to properly indicate output power requirements.
Application of the CCDF method for determining amplifier compression excels when considering the concept of gain compression applied to amplifiers that exhibit very soft compression characteristics. Amplifiers with class of operation outside of traditional Class A or specific device technologies add these complicating matters to performance characterization. These are specifically difficult to characterize since a reference gain cannot be determined using traditional small signal definitions.
An alternate power characteristic considers compression of some amplitude modulated signal through the use of a CCDF or similar. This method does not require a gain reference. It instead uses the statistical characteristics of the original input signal as a reference.
Given the background, a step by step process for measurements using CCDF curves is prescribed:
- To establish characterization frequencies of interest, the swept frequency gain is measured at a given, calibrated source power using a VNA. This source power must be chosen to guarantee some minimum level of output power. The points at which the gain, and hence output power is a minimum will be measured according to step two below.
- At the frequencies identified in step one as well as any other prescribed frequencies, the peak power at 1dB and 3dB compression of the output CCDF relative to the input CCDF at 0.01% probability will be measured.
A P1dB Example 1
Using a reference signal similar to the waveform described in Figure C; we suppose the input signal has a 9.8dB PAR at 0.01% probability. Operating the amplifier at one of the test frequencies points, the input power to the PA will be increased until the output CCDF at 0.01% probability reaches 9.8dB minus 1dB or 8.8dB. Further suppose that the average PA output power is 40.2dBm. The P1dB or peak power is the average output power plus the output PAR at 0.01% probability; i.e. 40.2dBm plus 8.8dB or 49dBm (~80W). This process is repeated for all other test frequencies to fully characterize P1dB across the amplifiers operating band.
A P3dB Example 2
Keeping consistent with Example 1 the input signal has a 9.8dB PAR at 0.01% probability. The input power to the PA is further increased until the output CCDF at 0.01% probability reaches 9.8dB minus 3dB or 6.8dB. At this point, suppose that the average PA output power is 43.2dBm. The P3dB or peak power is the average output power plus the output PAR at 0.01% probability; i.e. 43.2dBm plus 6.8dB or 50dBm (100W). This process is repeated for all other test frequencies to fully characterize P3dB across the amplifiers operating band.
Conclusion
When considering complex digital waveforms and class AB amplifiers, the CCDF curve surpasses other methods as the means to analyze the amplifiers compression characteristics and performance of peak power capabilities.
Because the method uses an established peak to average reference signal independent of the small signal amplifier characteristics the P1dB or P3dB compression points can be accurately determined for any given amplifier. Measurement complication reduces in amplifiers with class of operation outside of traditional Class A or for device technologies that present very soft compression characteristic. This is accomplished by eliminating the need to establish a subjective small signal reference gain. Furthermore, P1dB and P3dB determined by use of CCDF method can be correlated to traditional CW techniques.